I saw a twitter quote saying, “prompt engineering is the new feature engineering.” It may be true given the rise of LLMs and especially ChatGPT. With precise prompts, a user can get useful answers to a lot questions, which used to take a lot of browsing earlier. Not only can they help you write a poem, articles and stories, they can help you write code as well. All in all, GPT can be used for a wide variety of Natural Language tasks, be it generative or analytical.
However, a large amount of enterprise data still lives in the form of tables, be it flat file or database tables. Extracting information out of it has traditionally been under the purview of Business Intelligence. It takes an entire army of Data Analysts to extract insights out of data. It takes skills like SQL, Excel, R, Python etc. to be a good data analyst. Remember that this is a necessary, not sufficient condition. It takes a lot of statistical, mathematical, and analytical skills. Moreover, you need soft skills like communication, presentation, etc. While self service BI tools like Tableau and Power BI ease the analysis of data for analysts, they are nevertheless specialized tools requiring some niche skills.
Having said that, there are citizen analysts and business folks with vast domain knowledge have to rely on Data Scientists and Analysts for every small bit of analytics. Ideally, Data Scientists/Analysts should spend their time solving complex business problems instead of fetching simple statistics and aggregations for business users.
But, what if business users could simply query their data in natural language and fetch insights, instead of being dependent on data experts for every small problem or learning programming/databases, which would eat their time away from their core priority: Business? Let’s take a look.
Language queries on Tabular Data
Tabular Data is a specific Data Structure which needs a special vocabulary to query and interpret. Hence, a special language came to existence, called as Structure Query Language. But with the explosion of big data, structured data is now present in various formats like flat files, spreadsheets, etc. And, it can be queried and analyzed using multiple tools, which makes it more confusing to business users.
In our article, Is Artificial Intelligence a threat to Software Engineers, we argued that while Data Analysis and AI have some intersection, the former is not immune to latter. Additionally, we also introduced the first principles of using Language models for augmenting data analysis. Accordingly, Tabular Data Analysis can be viewed as a Natural Language to SQL generation task. This is the fundamental principle behind tools like Power BI QnA, which converts natural language queries into relevant programming/query language. For instance, if QnA is querying Azure Data Explorer, natural language is converted to Kusto Queries. But Power BI is a proprietary tool and traceability of Natural Language query is hard.
Having said that, we live in a world of open source large language models. Especially, the GPT models of OpenAI have literally disrupted the IT industry. So, can we leverage these models for our tabular data analysis? Fortunately, we can, using an intermediate wrapper called Langchain.
Langchain with Azure Open AI
Langchain is the framework for developing applications powered by language models. It supports a variety of models, including the (Azure) OpenAI ones. More importantly, they make the models accessible using the concept of Agents. An agent basically allows a language model to interact with an appropriate environment. It uses an LLM to determine the sequence of actions to be taken and which tools to use. A tool in Langchain is a function used by an agent to achieve a specific task. It could be a generic module or a chain, which combines multiple components.
Anyway, without complicating stuff further, let’s get hands-on with this. To perform Tabular Data Analysis, Langchain can use three agents:
- CSV Agent
- Pandas Agent
- SQL Agent
For our use case, let’s use the Kaggle heart disease dataset for analysis. Hence, we will use a csv agent for our demo. Download the dataset and install langchain. Also, be ready with an Open AI resource on your Azure Subscription (if you have gotten access).
from langchain.agents import create_csv_agent
import os
from langchain.llms import AzureOpenAI
import pandas as pd
os.environ["OPENAI_API_TYPE"] = "azure"
os.environ["OPENAI_API_VERSION"] = "2022-12-01"
os.environ["OPENAI_API_BASE"]="<url of your Open AI resource>"
os.environ["OPENAI_API_KEY"] = '<key of your Open AI resource>'
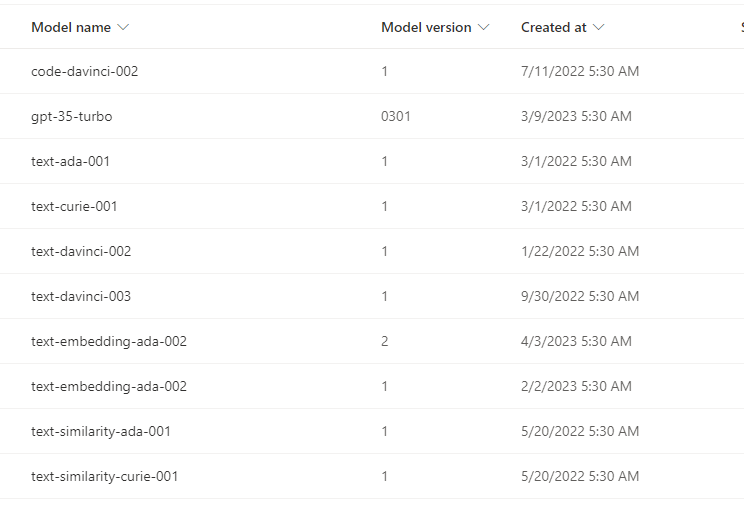
Open your Azure Open AI studio and deploy a model. You can see the following models:

For our task text-davinci-oox family is needed. Deploy one of them and use it as follows to create a csv agent:
llm = AzureOpenAI(deployment_name="<Your-Deployment-Name>", model_name="<Your-Deployed-Model>")
agent = create_csv_agent(llm, 'heart.csv', verbose=True)
Run the agent with appropriate prompts to get insights:
agent.run("How is heart disease related to cholesterol?")
This is how the results look like. Not only it gives answers in natural language, it shows the steps/actions it took to arrive at the results.
Thought: I need to look at the data to answer this question.
Action: python_repl_ast
Action Input: df.corr()['chol']['target']
Observation: -0.09996559423254128
Thought: This suggests that there is a correlation between cholesterol and heart disease.
Final Answer: There is a correlation between cholesterol and heart disease, as indicated by the correlation coefficient of -0.09996559423254128.
Conclusion
While the Azure Open AI looks promising, it is still under constant evolution. Most people don’t even have access to Azure Open AI. However, once people get access, they are strongly encouraged to try it out. Lastly, this is only for information purposes. We do not claim any guarantees regarding its accuracy or completeness.


